近期我負責的公司人力資源系統中,薪酬統計模塊的開發進度正穩步推進。在此過程中,我發現需要展示多種圖表(如 ECharts)來直觀反映數據。然而,ECharts 的配置過程相對復雜,頻繁查閱官方文檔不僅耗時,而且效率不高。為了提升開發效率,我萌生了這樣一個想法:將 ECharts 中的一些通用屬性進行提煉和整理,同時匯總常用的配置項以及在實際應用中需要注意的要點。這樣一來,不僅能夠簡化配置過程,還能為團隊提供一個便捷的參考指南。
EChart 資源
Vue-EChart
不想封裝 Echart, 可以選用這種方案。
Vue-ECharts 是一個 Vue 組件,旨在簡化在 Vue 應用中集成 ECharts 的過程。它封裝了 ECharts 的初始化和使用邏輯,用戶只需要在 Vue 模板中添加組件并傳遞相應的 props,即可輕松創建圖表。
支持Vue2 & Vue3 & Nuxt3
DOC: https://github.com/ecomfe/vue-echarts#readme

優點:
- Vue-ECharts 組件會自動處理 ECharts 實例的生命周期,能夠根據 Vue 組件的狀態變化自動更新圖表。這使得代碼更加簡潔,易于維護。
- 通過 Vue 的數據綁定機制,可以直接將數據綁定到組件的 props 上,Vue-ECharts 會自動將數據變化應用到圖表上。
- 作為 Vue 組件,可以很容易地與其他 Vue 組件組合,并且可以利用 Vue 的指令和事件系統。
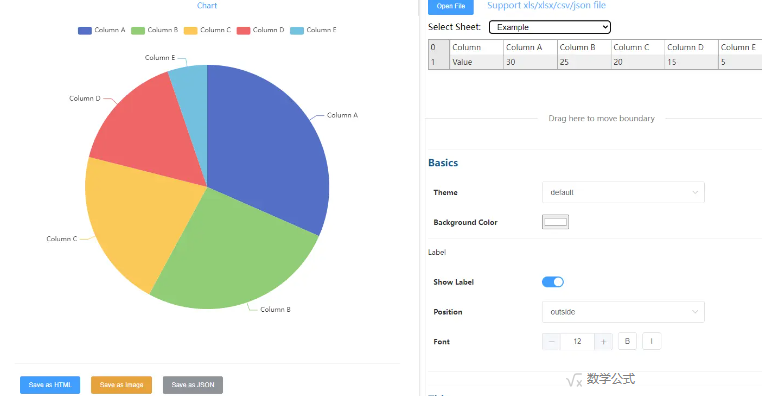
EChart 配置生成 option
目前只有三種圖表狀態,可生成圖片和JSON.
https://github.com/BruceHenry/chart-creator
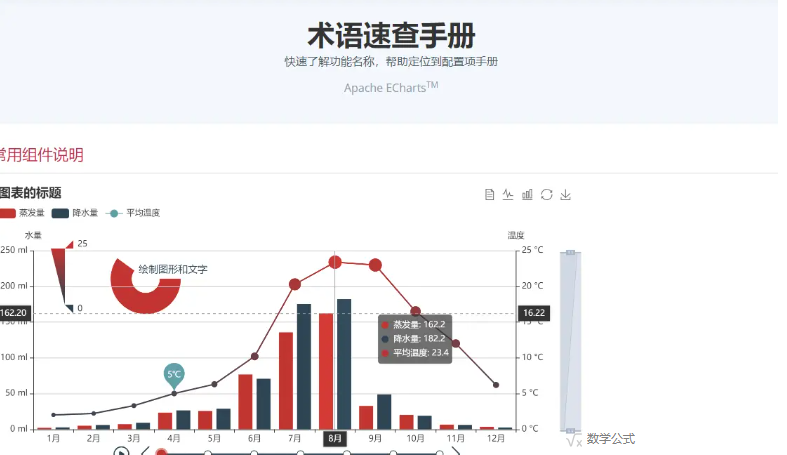
EChart 速查手冊 [官網]
https://echarts.apache.org/zh/cheat-sheet.html
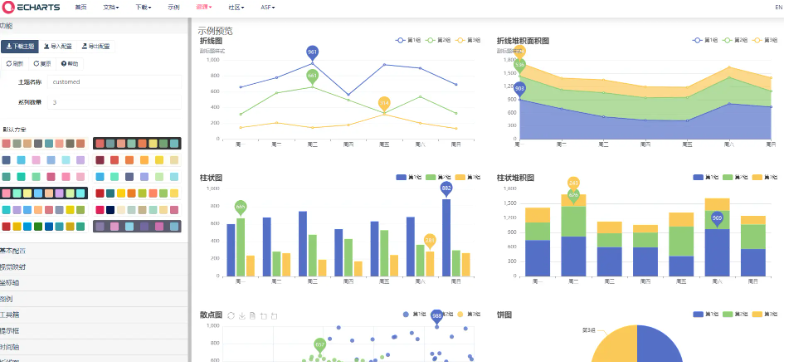
EChart 主題配置 [官網]
https://echarts.apache.org/zh/theme-builder.html
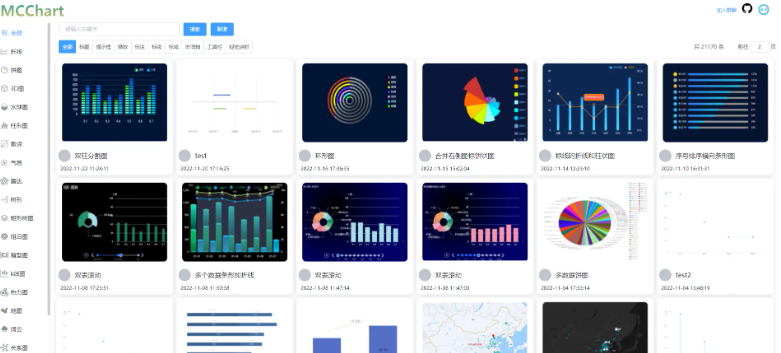
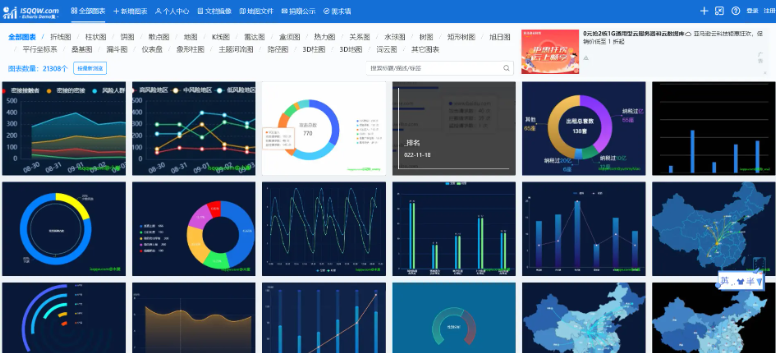
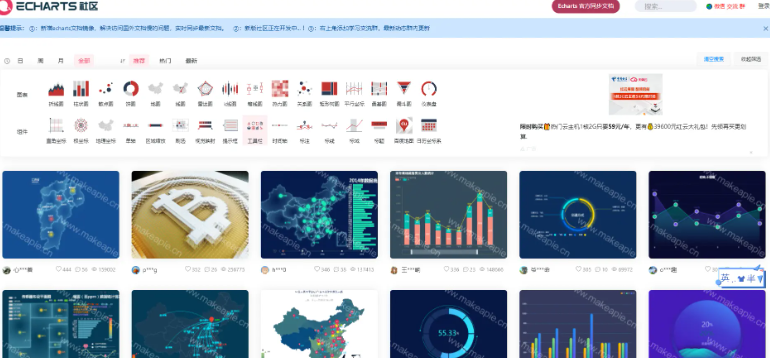
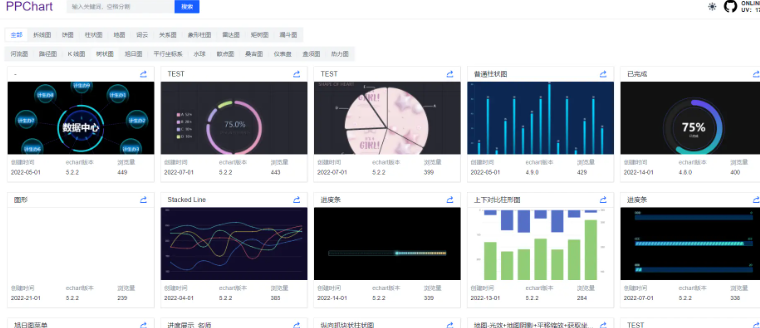
EChart 社區示例 [社區,提供了大量的示例基本可以滿足任何需求]
- MCChart
- isqqw
- MakeAPie
- PPChart
閱讀導圖
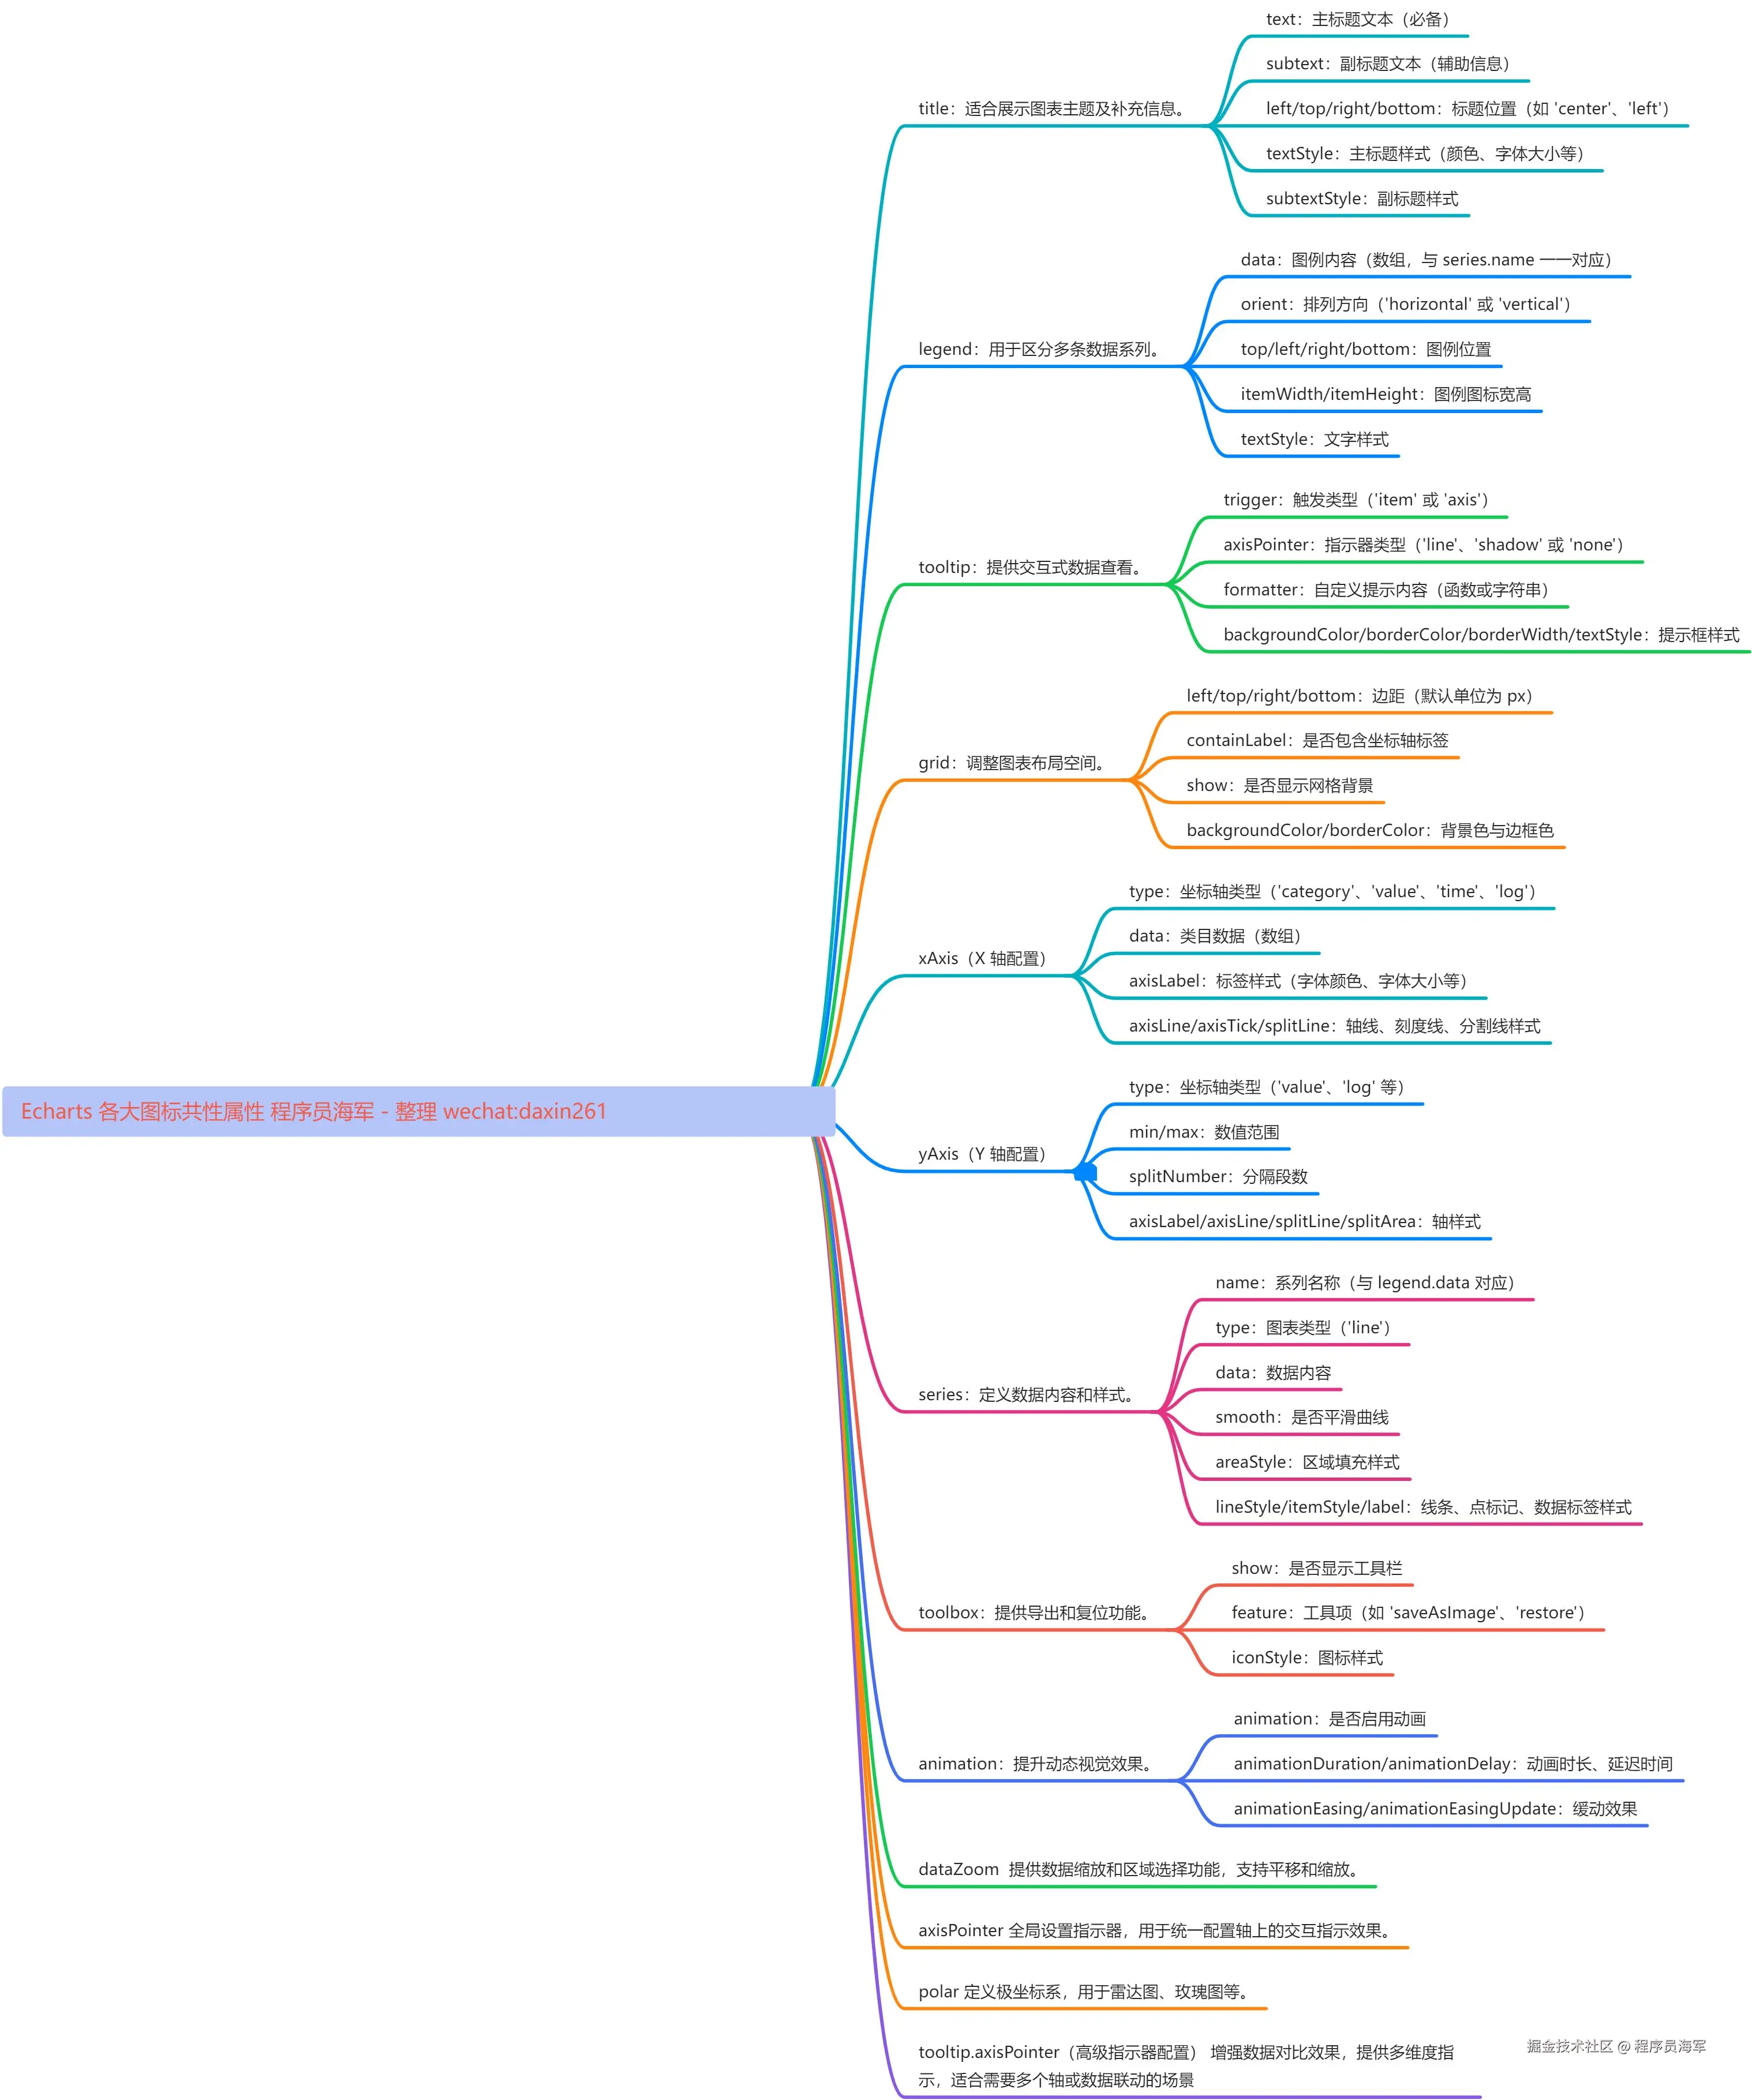
常用屬性配置
title 標題配置
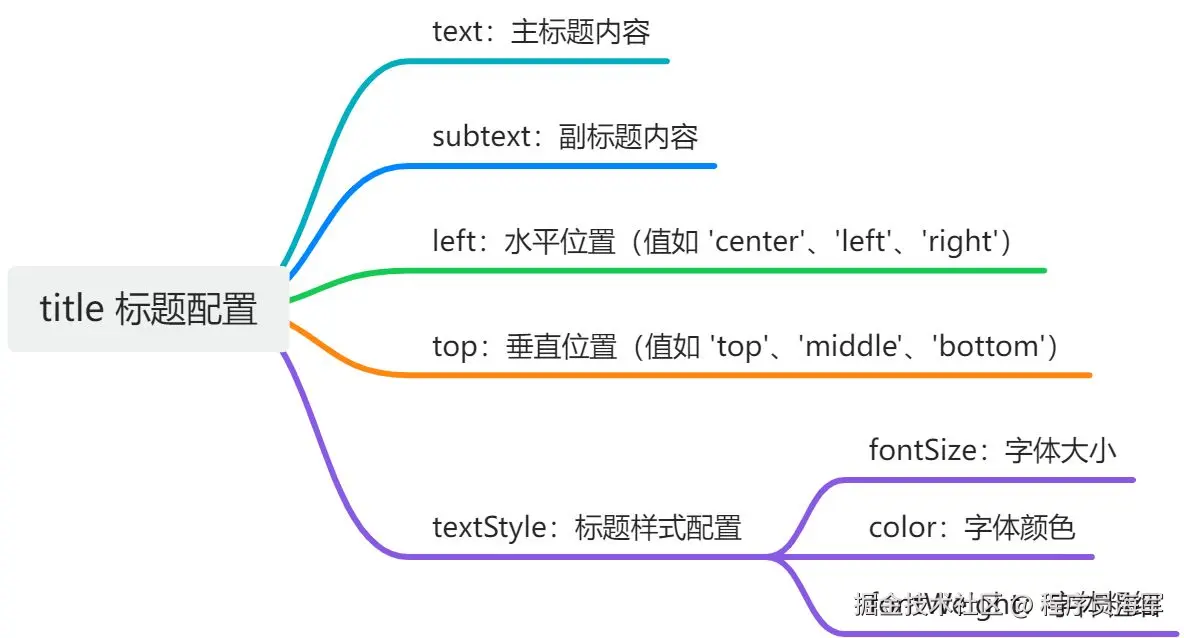
- text - 標題文本,例如 "柱狀圖"
- subtext- 副標題文本***
- *left 標題的水平位置,可以是像'left' 'center' 'right' 或者像'20%' 這樣的百分比
- top*** **- 標題的垂直位置,可以是像** **'top',**** __'middle'__,__** __'bottom'__** __或者像**__** __'20%'__ __這樣的百分比***
- textStyle*** **- 控制標題文本樣式的對象,可以包括** ****color****,fontStyle,fontWeight,fontFamily,*fontSize****** ****等
- subtextStyle*** **- 控制副標題文本樣式的對象,屬性同** ****textStyle*
- textAlign*** **- 標題文本對齊,例如** **'left',**** __'right'__,**__** __'center'***
- padding*** **- 標題內邊距,可以是數字或數組** ****[上, 右, 下, 左]*
- itemGap - 主副標題之間的間距
option = {
title: {
text: '主標題文本',
subtext: '副標題文本',
left: 'center',
top: 'top',
textStyle: {
color: 'black',
fontStyle: 'normal',
fontWeight: 'bold',
fontFamily: 'Arial',
fontSize: 18,
},
subtextStyle: {
color: '#aaa',
fontStyle: 'normal',
fontWeight: 'normal',
fontFamily: 'Arial',
fontSize: 12,
},
textAlign: 'center',
padding: [5, 10],
itemGap: 10
},
};
- formatter - 提示框浮層的內容格式器,支持字符串模板和回調函數兩種形式
- axisPointer - 坐標軸指示器配置,指定其類型如 'line'、'shadow' 等
- show - 是否顯示提示框組件,包括提示框浮層和 axisPointer,默認為*** ***true
- backgroundColor - 提示框浮層的背景顏色
- borderColor - 提示框浮層的邊框顏色
- borderWidth - 提示框浮層的邊框寬
- padding - 提示框浮層內邊距,可以是數字或數組 __[上, 右, 下, 左]**
tooltip: {
trigger: 'axis',
formatter: function (params) {
let res = params[0].name + '<br>';
params.forEach(function (item) {
res += item.seriesName + ': ' + item.value + '<br>';
});
return res;
},
axisPointer: {
type: 'shadow'
},
show: true,
backgroundColor: 'rgba(50,50,50,0.7)',
borderColor: '#333',
borderWidth: 0,
padding: 10
},
legend(圖例組件)
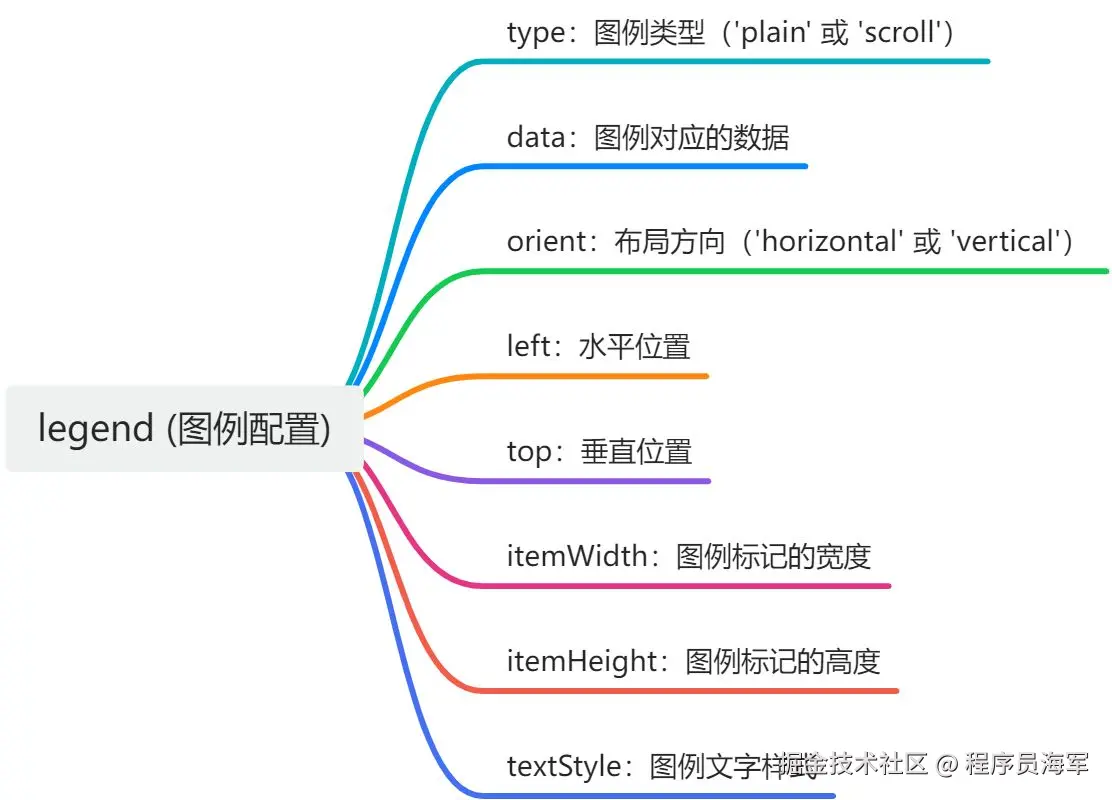
圖表的圖例,表示不同系列的標識。
legend: {
    top: '5%',
    left: 'center',
    data: ['直接訪問', '聯盟廣告', '搜索引擎']
}
series(系列列表)
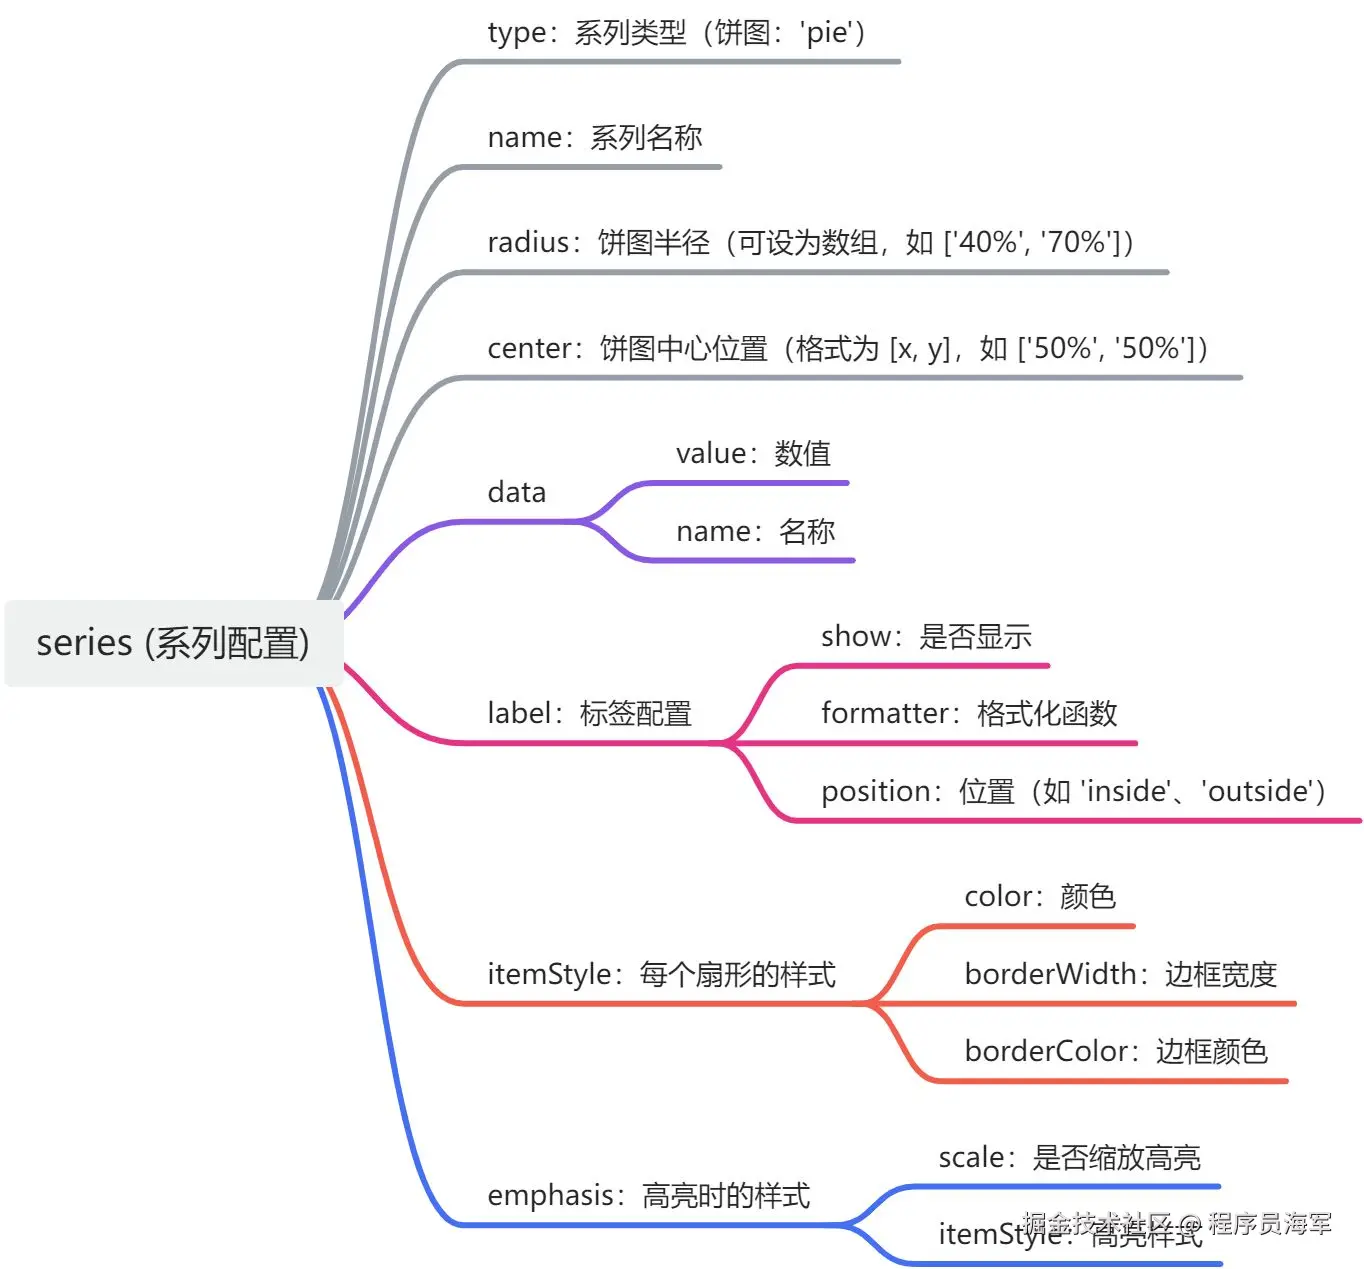
每個 series 代表一組數據項的集合,對于餅圖配置的主要部分。
series 屬性及其可能的值包括:
- type: 'pie' // 必須設置為 'pie' 表示這是一個餅圖。
- radius: 半徑,可以是百分比或固定像素值,也可以是數組形式表示內外半徑。
- center: Pie圖的中心位置。
- data: 數據項數組,每個數據項包括 value(數值)和 name(名稱)。
- stillShowZeroSum: 如果所有數據值都是0,是否顯示圖形。
- label: 用于設置數據標簽,如是否顯示、位置、格式等。
series: [
{
name: '訪問來源',
type: 'pie',
radius: '50%',
center: ['50%', '50%'],
data: [
{value: 335, name: '直接訪問'},
{value: 234, name: '聯盟廣告'},
{value: 1548, name: '搜索引擎'}
],
emphasis: {
itemStyle: {
shadowBlur: 10,
shadowOffsetX: 0,
shadowColor: 'rgba(0, 0, 0, 0.5)'
}
},
stillShowZeroSum: true,
label: {
normal: {
show: true,
position: 'outside'
},
emphasis: {
show: true,
textStyle: {
fontSize: '30',
fontWeight: 'bold'
}
}
}
}
]

color (配色方案)
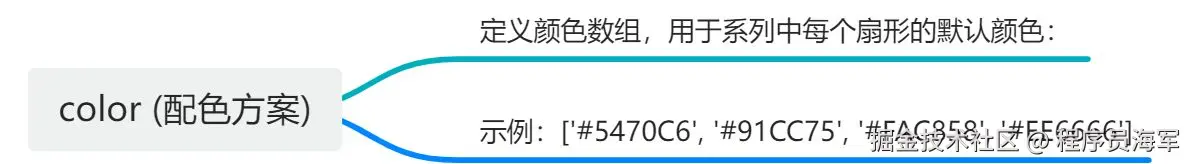
定義顏色數組,用于系列中每個扇形的默認顏色:
- 示例:
<font style="color:rgb(46, 50, 56);">['#5470C6', '#91CC75', '#FAC858', '#EE6666']</font>
animation (動畫配置)

完整配置示例代碼
option = {
title: {
text: 'Pie Chart Example'
},
tooltip: {
trigger: 'item'
},
legend: {
top: '5%',
left: 'center',
data: ['Direct Visit', 'Union Ad', 'Search Engine']
},
toolbox: {
show: true,
feature: {
saveAsImage: {},
restore: {}
}
},
series: [
{
name: 'Access From',
type: 'pie',
radius: '55%',
center: ['50%', '60%'],
data: [
{ value: 335, name: 'Direct Visit' },
{ value: 234, name: 'Union Ad' },
{ value: 1548, name: 'Search Engine' }
],
emphasis: {
itemStyle: {
shadowBlur: 10,
shadowOffsetX: 0,
shadowColor: 'rgba(0, 0, 0, 0.5)'
}
},
label: {
normal: {
show: true,
position: 'outside',
formatter: '{b}: {c} (v6fgzc1vch%)'
},
emphasis: {
show: true,
textStyle: {
fontSize: '30',
fontWeight: 'bold'
}
}
}
}
]
};
EChart 在 Vue3 中實戰
const chart = ref(null);
const initChart = () => {
if (chart.value) {
const myChart = echarts.init(chart.value);
myChart.setOption(props.option);
}
};
watch(
() => props.option,
(newOption) => {
if (chart.value) {
const myChart = echarts.getInstanceByDom(chart.value);
myChart.setOption(newOption);
}
}
);
響應式處理
圖表在窗口大小變化時能夠自動調整。可以使用 resize() 方法手動調整圖表大小,通常是在 updated 生命周期鉤子中調用。
const resizeChart = () => {
if (chart.value) {
const myChart = echarts.getInstanceByDom(chart.value);
myChart.resize();
}
};
onMounted(() => {
initChart();
window.addEventListener('resize', resizeChart);
});
動態數據更新
使用 Vue 的響應式數據(如 ref 或 reactive)配合 watch,在數據變化時調用 chart.setOption() 重新渲染圖表。
const chartOption = ref({
title: { text: '實時數據' },
tooltip: { trigger: 'axis' },
xAxis: { data: ['1', '2', '3', '4', '5'] },
yAxis: {},
series: [{
name: '銷量',
type: 'line',
data: [120, 132, 101, 134, 90]
}]
});
watch(
() => props.option,
(newOption) => {
if (chartInstance.value) {
chartInstance.value.setOption(newOption);
}
},
{ deep: true }
);
chartOption.value.series[0].data.push(Math.random() * 100);
chartOption.value.xAxis.data.push(String(chartOption.value.xAxis.data.length + 1));
圖表容器大小自適應
父容器尺寸發生變化時,圖表可能不會自動調整大小。 我們可以通過 監聽 resize 事件或使用 Vue 的響應式布局方案,調用 chart.resize() 更新圖表尺寸。
const observer = new ResizeObserver(() => {
chartInstance.value?.resize();
});
observer.observe(containerElement);
國際化與多語言支持
圖表中包含的文案(如標題、提示)需要支持多語言。 我們可以使用 Vue I18n 或其他國際化工具動態替換文本。
npm install vue-i18n
import { useI18n } from 'vue-i18n';
const { t } = useI18n();
const option = reactive({
  title: { text: t('chart.title') },
});
ECharts 圖表導出
toolbox: {
  feature: {
    saveAsImage: { show: true },
  },
};
性能優化
銷毀 ECharts 實例
在組件銷毀時,確保銷毀 ECharts 實例,防止內存泄漏。
onBeforeUnmount(() => {
if (chart.value) {
const myChart = echarts.getInstanceByDom(chart.value);
myChart.dispose();
}
window.removeEventListener('resize', resizeChart);
});
大數據渲染性能優化
數據量大時,ECharts 的渲染可能會導致性能瓶頸。 我們可以通過以下三種方式來達到優化作用
- 使用
**dataZoom**: 允許用戶縮放數據區域,減少可視數據點。 - 啟用分片渲染:
series: [
{
type: 'line',
large: true,
largeThreshold: 4000,
},
];
animation: false,
progressive: 4000,
progressiveThreshold: 10000,
圖表配置項太長,分離配置項
配置項代碼過長,組件可讀性降低。我們可以將配置項提取到單獨的模塊,便于復用和維護。
EChart 知識點常考
如何初始化和銷毀 ECharts 實例?
echarts.init(dom) 初始化。chart.dispose() 銷毀實例,避免內存泄漏。
ECharts 常見配置項有哪些?
title, legend, tooltip, grid, xAxis, yAxis, series, toolbox, dataZoom。
動態數據更新
- 如何實現圖表數據的動態更新?
- 如何監聽 `props` 變化并更新圖表配置?
性能優化
- 大數據渲染場景如何優化?
- 什么是 `progressive` 渲染模式?
圖表事件
- 如何捕獲圖表點擊、懸停事件并執行對應的業務邏輯?
如何處理數據較多導致渲染卡頓的情況?
- 使用數據分片渲染(
progressive)。 - 禁用動畫。
- 使用
dataZoom 限制顯示范圍。
如何實現圖表導出功能?
使用 toolbox.feature.saveAsImage 或通過 chart.getDataURL() 獲取圖表數據并導出。
最后
通過對 ECharts 通用屬性的深入提煉與系統整理,以及常用配置項的歸納總結,我們能夠迅速實現圖表的搭建與展示,極大地提升了開發效率。此外,借助豐富的 ECharts 資源和示例,我們基本上能夠滿足大部分業務場景的需求。這樣一來,我們不僅能夠更加快捷地實現功能需求,還能騰出更多寶貴的時間,專注于其他重要任務。
?轉自https://www.cnblogs.com/HaiJun-Aion/p/18569547
該文章在 2025/2/8 10:54:56 編輯過


 400 186 1886